Analyzing QoS Events and Statistics
If you have enabled logging for the connections that also match your QoS rule conditions, you can view the QoS-related statistics in the Connection Events page. Here are the steps to view them:
Step 1. Navigate to Analysis > Connections > Events.
Step 2. Select Connection Events as the table view.
Step 3. Expand the Search Constraints arrow on the left.
Step 4. Select the necessary QoS-related data points.
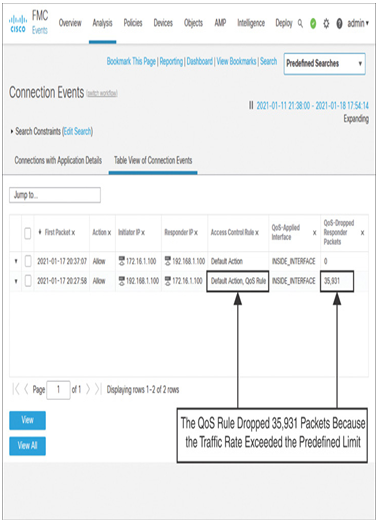
Figure 20-17 shows two connection events. The bottom connection is originated by an inside client, which matched the conditions in the QoS Rule, and the traffic rate is limited accordingly. However, the connection at the top is not rate-limited because it is initiated by a host located at the outside zone.

Figure 20-17 Connection Events Showing Associated QoS Rules
Example 20-2 demonstrates the actions of a QoS policy on a threat defense. This example provides two commands that you can use to determine any drop due to a QoS rule during a file transfer.
Example 20-2 Statistics of Dropped Packets Due to a QoS Policy
! Record on the service policy statistics
>
show service-policy police
Interface INSIDE_INTERFACE:
Service-policy:
policy_map_INSIDE_INTERFACE
Flow-rule
QoS id: 268462080
Input police Interface INSIDE_INTERFACE:
cir 8000000 bps, bc 250000 bytes
conformed 309884 packets, 233417067 bytes; actions: transmit
exceeded 10459 packets, 14979835 bytes; actions: drop
conformed 454552 bps, exceed 29168 bps
Output police Interface INSIDE_INTERFACE:
cir 40000000 bps, bc 1250000 bytes
conformed 499249 packets, 673878828 bytes; actions: transmit
exceeded 58971 packets, 84562922 bytes; actions: drop
conformed 1312296 bps, exceed 164672 bps
>
! Statistics of the Accelerated Security Path (ASP) counts
>
show asp drop
Frame drop:
No route to host (no-route) 2049
Reverse-path verify failed (rpf-violated) 137
Flow is denied by configured rule (acl-drop) 1946
First TCP packet not SYN (tcp-not-syn) 53
TCP failed 3 way handshake (tcp-3whs-failed) 30
Output QoS rate exceeded (rate-exceeded) 69430
Slowpath security checks failed (sp-security-failed) 173
FP L2 rule drop (l2_acl) 705
Interface is down (interface-down) 5
Last clearing: Never
Flow drop:
Last clearing: Never
>
Example 20-3 reveals the connections that are rate-limited by a QoS rule. The flags associated with a connection confirm whether the traffic is going through a deep packet inspection process. To determine the meaning of each flag, you can use the detail keyword. For example, the flag N confirms that the Snort engine is inspecting the connection.
Example 20-3 Identifying the Status of a Rate-Limited Connection
>
show conn detail
1 in use, 6 most used
Inspect Snort:
preserve-connection: 1 enabled, 0 in effect, 6 most enabled, 0 most in
effect
Flags: A – awaiting responder ACK to SYN, a – awaiting initiator ACK to SYN,
b – TCP state-bypass or nailed,
C – CTIQBE media, c – cluster centralized,
D – DNS, d – dump, E – outside back connection, e – semi-distributed,
F – initiator FIN, f – responder FIN,
G – group, g – MGCP, H – H.323, h – H.225.0, I – initiator data,
i – incomplete, J – GTP, j – GTP data, K – GTP t3-response
k – Skinny media, L – decap tunnel, M – SMTP data, m – SIP media
N – inspected by Snort (1 – preserve-connection enabled, 2 – preserve-
connection in effect)
n – GUP, O – responder data, o – offloaded,
P – inside back connection, p – passenger flow
q – SQL*Net data, R – initiator acknowledged FIN,
R – UDP SUNRPC, r – responder acknowledged FIN,
T – SIP, t – SIP transient, U – up,
V – VPN orphan, v – M3UA W – WAAS,
w – secondary domain backup,
X – inspected by service module,
x – per session, Y – director stub flow, y – backup stub flow,
Z – Scansafe redirection, z – forwarding stub flow
TCP OUTSIDE_INTERFACE: 172.16.1.100/80 INSIDE_INTERFACE: 192.168.1.100/63860,
flags UIO N1,
qos-rule-id 268462080
, idle 0s, uptime 50s, timeout 1h0m, bytes
283367890
Initiator: 192.168.1.100, Responder: 172.16.1.100
Connection lookup keyid: 4524219
>
Example 20-4 shows the real-time debug messages generated by the firewall and Snort engines, due to the match of a QoS rule (ID: 268442624).
Example 20-4 Debugging the QoS Rule–Related Events in Real Time
! Debug messages in the firewall engine:
>
system support firewall-engine-debug
Please specify an IP protocol:
tcp
Please specify a client IP address:
Please specify a client port:
Please specify a server IP address:
Please specify a server port:
Monitoring firewall engine debug messages
! Output is truncated for brevity
.
.
192.168.1.100-63883 > 172.16.1.100-80 6 AS 1-1 I 0 Starting QoS with minimum 0, id 0
and SrcZone first with zones 1 -> 2, geo 0 -> 0, vlan 0, source
sgt type: 0, source sgt tag: 0, ISE sgt id: 0, dest sgt type: 0, ISE dest sgt tag: 0, svc 0, payload 0,
client 0, misc 0, user 9999997, icmpType 0, icmpCode 0
192.168.1.100-63883 > 172.16.1.100-80 6 AS 1-1 I 0 match rule order 1, id 268462080
action Rate Limit
192.168.1.100-63883 > 172.16.1.100-80 6 AS 1-1 I 0 QoS policy match status (match
found), match action (Rate Limit),
QoS rule id (268462080)
^C
Caught interrupt signal
Exiting.
>
The statistics in these examples were captured when a client PC was downloading a large ISO file from the server using a web browser. You could perform a similar analysis on uploaded traffic. Before you begin uploading a file from the client PC to the server, you can run the following commands to reset the counters.
>
clear service-policy interface INSIDE_INTERFACE
>
clear asp drop
Leave a Reply